Benchmark Methodology for Aerial Platforms
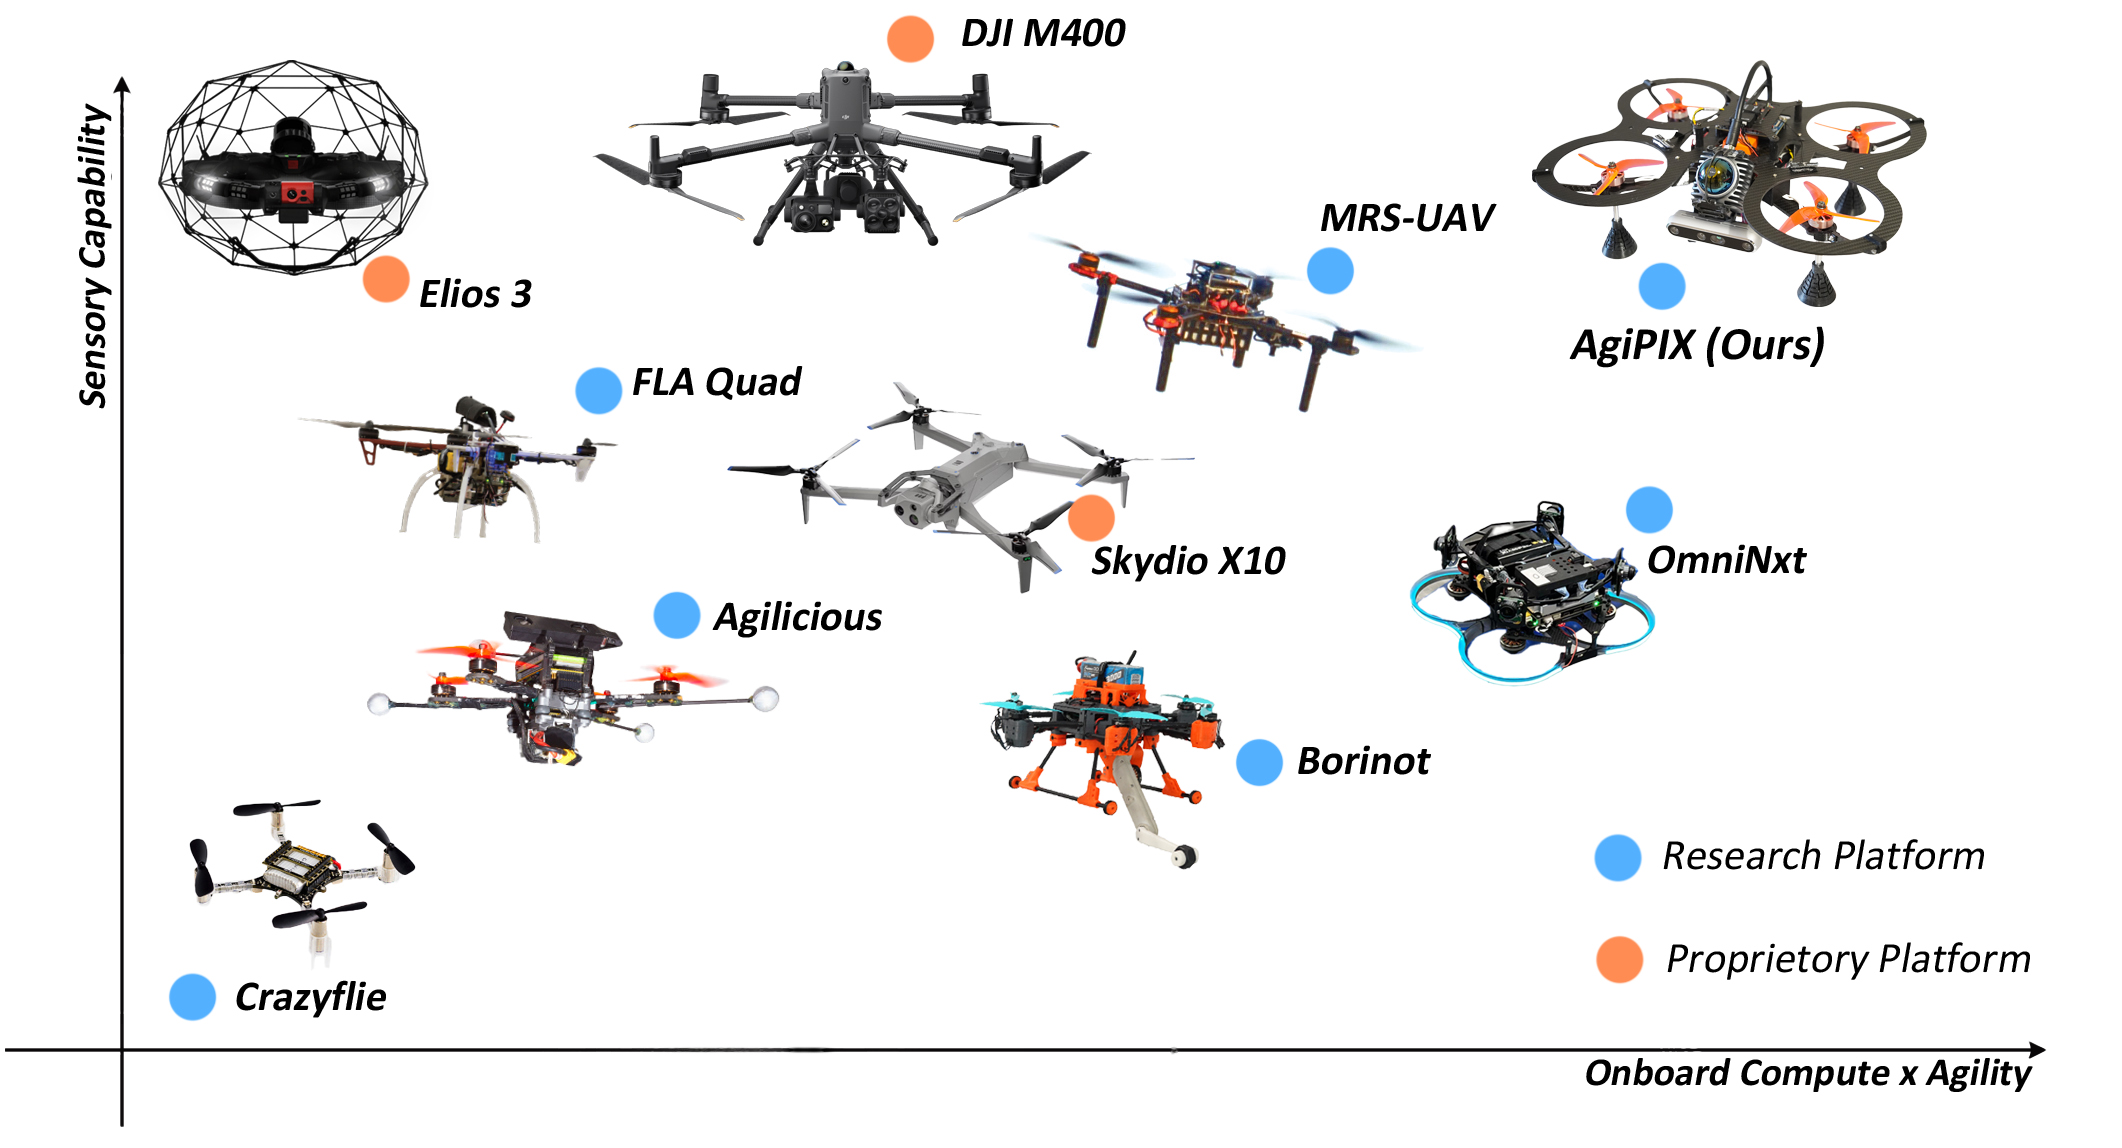
Evaluating Platform Intelligence and Agility
Designing a compact, actively sensed aerial robotics platform for indoor environments demands careful trade-offs between raw compute power, agility, and the payload’s sensory capability. Traditional benchmarks often evaluate these metrics in isolation (e.g., pure AI TOPS for compute, or Thrust-to-Weight Ratio for agility). However, the true efficacy of an autonomous platform lies in its combined capacity to process complex environments and act upon them rapidly.
To quantitatively evaluate and compare AgiPIX against existing industrial and research platforms, we define a composite benchmarking methodology.
1. Composite Compute Score
The compute architecture of aerial platforms must balance both high-level AI inference (for perception and planning) and robust real-time responsiveness (for state estimation and control OS loops).
To reflect this, our benchmark establishes a Composite Score (\(C\)) combining:
- CPU PassMark (\(P\)): Representing general-purpose compute required for deterministic control tasks.
- Compute TOPS (\(T\)): Representing AI acceleration capabilities.
These values are normalized against the maximum known bounds within the dataset (\(P_{\max}\) and \(T_{\max}\)). A weighting factor \(\alpha\) is utilized to emphasize that in autonomous aerial robotics, a strong CPU backbone is fundamental to ensure real-time stability, even if pure AI accelerators are present. The composite score is defined as:
\[C = \min\left(1, \; \alpha \frac{P}{P_{\max}} + (1 - \alpha) \frac{T}{T_{\max}}\right)\](In our evaluation, we utilize \(\alpha = 0.6\) to prioritize CPU performance).
2. The Agility Multiplier
Raw intelligence must be actionable. We utilize the Thrust-to-Weight Ratio (TWR) as a proxy for platform Agility (\(A\)). By multiplying the Composite Score by the Agility, we derive a unified metric:
\[M = C \times A\]This unified metric, \(M\), represents the drone’s holistic ability to compute decisions and execute physical maneuvers rapidly.
3. Sensory Capability Mapping
The final analysis maps this unified compute-agility metric (\(M\)) against a qualitative Sensory Capability scale (\(S \in [1, 5]\)).
Plotting \(S\) against \(M\) reveals the Pareto front of design trade-offs—demonstrating how different platforms allocate weight and volume budgets between “smart agility” and heavy sensory payloads.
Benchmark Script Output
Below is the composite performance evaluation for the first 10 systems evaluated:
Composite performance example (first 10 systems):
         Platform  CPU_PassMark  Compute_TOPS  Composite_Score
         DJI M400          2418    100.000000         0.411383
       SkyDio X10          2418    117.000000         0.454695
Flyability Elios3          1343     21.000000         0.140485
        Crazyflie            10      0.000336         0.000649
         FLA-Quad          3383      0.050000         0.219234
           Bornot          6190      0.134000         0.401248
          MRS UAV          9264      0.226000         0.600576
       Agilicious          1343     13.300000         0.120867
          OmniNxt          2418    117.000000         0.454695
    AgiPIX (Ours)          2418    157.000000         0.556606
Source Code
The full logic and data extraction is available in bench_platforms.py:
import pandas as pd
import matplotlib.pyplot as plt
from typing import Iterable, Tuple

# -----------------------------------------
# CONFIG
# -----------------------------------------
# Compute in TOPS (or consistent TOPS unit)
# Agility = TWR
# Sensory capability = 1–5 scale
# Diagonal span in millimeters (approximate; update with real values)
# CPU PassMark is the CPU benchmark score (use None if unknown)


#TOPS to TFLOPS conversion (if needed): # ref https://forums.developer.nvidia.com/t/what-is-tops-of-tx2-board/117375/6
# "In general, the performance can be represent theoretically to X TFLOPS for FP16 or 2X TOPS for INT8 if both type are supported"

## assumptions made for the sake of comparison
## Though not explicitly stated follwoing assumptions are made for the TOPS estimation
# DJI M400: 100 TOPS ref https://enterprise.dji.com/manifold-3
# SkyDio X10: 117 TOPS, qrb5165 Cortex A77 - Jetson Orin SOC Most likely NX due to the size ref https://www.skydio.com/x10/technical-specs, https://www.nvidia.com/en-us/autonomous-machines/embedded-systems/jetson-orin/
# Flyability Elios3: 21 TOPS -2.12 TFLOPS Nvidia Xavier NX ref https://nexxis.com.au/wp-content/uploads/2020/11/20220519_E3_Tech_Spec_web_version.pdf, https://www.nvidia.com/en-us/autonomous-machines/embedded-systems/jetson-xavier-nx/
# Crazyflie: 0.000336 TOPS - STM32F405 ref https://www.bitcraze.io/2024/01/crazyflie-2-1-now-with-10-tops-of-compute/
# FLA-Quad: 0.05 TOPS Intel i7-5557U processor refhttps://arxiv.org/abs/1712.02052
# Bornot: 0.134 TOPS - i7-8650U ref https://arxiv.org/pdf/2307.14686
# MRS UAV: 0.226 TOPS - i7-10710U ref https://arxiv.org/pdf/2306.07229
# Agilicious: 13.3 TOPS - 1.33 TFLOPS Nvidia Jetson TX2 ref #TOPS to TFLOPS conversion (if needed): # ref https://forums.developer.nvidia.com/t/what-is-tops-of-tx2-board/117375/6
        # "In general, the performance can be represent theoretically to X TFLOPS for FP16 or 2X TOPS for INT8 if both type are supported"
# OmniNxt: 117 TOPS - Nvidia Jetson NX ref https://www

"""
Compute Capability Estimate – Intel Core i7-10710U (CPU-only)

This system uses an Intel Core i7-10710U:
    - 6 cores / 12 threads
    - Base clock: 1.1 GHz
    - Turbo clock: up to 4.7 GHz
    - Supports AVX2 (256-bit SIMD)
    - No dedicated NPU / AI accelerator

CPUs do not have an official TOPS rating. However, we can estimate a
theoretical upper bound for floating-point throughput using AVX2.

Assumptions for peak single-precision FLOPS:
    - AVX2 = 256-bit vector width
    - 256 bits = 8 x 32-bit floats per vector instruction
    - Assume 1 vector FMA per cycle (ideal case)
    - Use max turbo frequency (4.7 GHz)
    - All 6 cores fully utilized

Theoretical peak FLOPS:

    FLOPS ≈ cores × FLOPs_per_cycle × frequency

    FLOPS ≈ 6 × 8 × 4.7e9
           ≈ 225.6e9 FLOPS
           ≈ 225 GFLOPS
           ≈ 0.226 TFLOPS
           ≈ 0.226 TOPS (if counting 1 FLOP as 1 operation)

Important:
    - This is a best-case theoretical peak.
    - Real sustained performance will be significantly lower.
    - Memory bandwidth, cache misses, branching, and non-vectorized code
      reduce actual throughput.
    - This is NOT comparable to dedicated AI accelerators (NPUs/GPUs)
      that achieve tens to thousands of TOPS.

Practical takeaway:
    Expect roughly 0.2–0.3 TOPS theoretical peak CPU compute.
    Real AI inference throughput depends heavily on optimization
    (e.g., OpenVINO, ONNX Runtime, quantization).
"""

# Toggle log scale for compute (TOPS) axis in plot 1
USE_LOG_SCALE = False

# Toggle to use Composite_Score for plots 1–3 instead of compute-based metrics
USE_COMPOSITE_FOR_PLOTS = True

DEFAULT_ALPHA = 0.6 # for robotics heavy workloads, we may want to prioritize CPU performance more than pure compute, as it can impact overall system responsiveness and real-time control. However, this can be adjusted based on specific use cases and preferences.
# benchmark = Nvidia Jetson agx orin with CPU PassMark score of 5653 compute capability of 275 TOPS https://www.nvidia.com/en-us/autonomous-machines/embedded-systems/jetson-orin/
REFERENCE_CPU_PASSMARK = 5653
REFERENCE_MAX_TOPS = 725


# -----------------------------------------
# METRIC UTILITIES
# -----------------------------------------


def _clamp(value: float, minimum: float = 0.0, maximum: float = 1.0) -> float:
    return max(minimum, min(value, maximum))


def composite_performance_score(
    cpu_score: float,
    ai_tops: float,
    max_cpu_score: float,
    max_ai_tops: float,
    alpha: float = DEFAULT_ALPHA,
) -> Tuple[float, str]:
    """
    Compute a normalized composite performance score from CPU PassMark and AI TOPS.

    Assumptions:
        - CPU score and TOPS are not directly comparable, so both are normalized to [0, 1].
        - The result is a weighted combination where alpha controls CPU importance.
        - Inputs may be missing or zero; division-by-zero is avoided and outputs are clamped.
    """

    safe_max_cpu = max(max_cpu_score, 0.0)
    safe_max_ai = max(max_ai_tops, 0.0)

    normalized_cpu = cpu_score / safe_max_cpu if safe_max_cpu > 0 else 0.0
    normalized_ai = ai_tops / safe_max_ai if safe_max_ai > 0 else 0.0

    composite = _clamp(alpha * normalized_cpu + (1.0 - alpha) * normalized_ai)

    if composite > 0.75:
        label = "High Performance"
    elif composite >= 0.4:
        label = "Balanced / Mid-range"
    else:
        label = "Entry-level"

    return composite, label


def plot_cpu_vs_tops(systems: Iterable[Tuple[str, float, float]], title: str) -> None:
    """
    Plot CPU PassMark vs AI TOPS for a list of systems.

    Each system is (name, cpu_passmark, ai_tops).
    """

    plt.figure()
    for name, cpu_score, ai_tops in systems:
        plt.scatter(cpu_score, ai_tops)
        plt.text(cpu_score, ai_tops, name)

    plt.xlabel("CPU PassMark")
    plt.ylabel("AI Compute (TOPS)")
    plt.title(title)
    plt.grid(True)
    plt.show()


def plot_scatter_with_labels(
    df: pd.DataFrame,
    x_key: str,
    y_key: str,
    xlabel: str,
    ylabel: str,
    title: str,
    log_x: bool = False,
) -> None:
    plt.figure()
    plt.scatter(df[x_key], df[y_key])

    for _, row in df.iterrows():
        plt.text(row[x_key], row[y_key], row["Platform"])

    plt.xlabel(xlabel)
    plt.ylabel(ylabel)
    plt.title(title)
    if log_x:
        plt.xscale("log")
    plt.grid(True)
    plt.show()


def build_dataframe() -> pd.DataFrame:
    data = [
        # name, compute_TOPS, cpu_passmark, agility_TWR, sensory_capability, diagonal_span_mm
        ["DJI M400",         100, 2418, 2.30, 5, 1240],
        ["SkyDio X10",       117, 2418, 2.60, 3, 1023],
        ["Flyability Elios3",21, 1343, 1.80, 4, 480],
        ["Crazyflie",        0.000336, 10, 2.26, 1, 92],
        ["FLA-Quad",         0.05, 3383, 2.38, 3.5, 300],
        ["Bornot",           0.134, 6190, 3.50, 2, 516],
        ["MRS UAV",          0.226, 9264, 2.50, 4, 792],
        ["Agilicious",       13.3, 1343, 5.00, 2.5, 382],
        ["OmniNxt",          117, 2418, 4.24, 3, 250],
        ["AgiPIX (Ours)",    157, 2418, 3.50, 4, 495],  # Orin NX 16gb (Super)
    ]

    df = pd.DataFrame(
        data,
        columns=[
            "Platform",
            "Compute_TOPS",
            "CPU_PassMark",
            "Agility_TWR",
            "Sensory_1to5",
            "Diagonal_Span_mm",
        ],
    )

    max_cpu_score = df["CPU_PassMark"].max()
    max_ai_tops = df["Compute_TOPS"].max()

    df["Compute_x_Agility"] = df["Compute_TOPS"] * df["Agility_TWR"]
    df["Compute_x_Agility_per_Span"] = df["Compute_x_Agility"] / df["Diagonal_Span_mm"]

    composite_results = df.apply(
        lambda row: composite_performance_score(
            cpu_score=row["CPU_PassMark"],
            ai_tops=row["Compute_TOPS"],
            max_cpu_score=max_cpu_score,
            max_ai_tops=max_ai_tops,
        ),
        axis=1,
    )
    df[["Composite_Score", "Composite_Label"]] = pd.DataFrame(
        composite_results.tolist(), index=df.index
    )

    df["Composite_Score_x_Agility"] = df["Composite_Score"] * df["Agility_TWR"]
    df["Composite_Score_x_Agility_per_Span"] = (
        df["Composite_Score_x_Agility"] / df["Diagonal_Span_mm"]
    )

    return df


def main() -> None:
    df = build_dataframe()

    example_systems = df.loc[
        :9, ["Platform", "CPU_PassMark", "Compute_TOPS", "Composite_Score", "Composite_Label"]
    ]
    print("Composite performance example (first 10 systems):")
    print(example_systems.to_string(index=False))

    plot1_x = "Composite_Score" if USE_COMPOSITE_FOR_PLOTS else "Compute_TOPS"
    plot1_xlabel = "Composite Score" if USE_COMPOSITE_FOR_PLOTS else "Compute (TOPS)"
    plot1_title = (
        "Agility vs Composite Score" if USE_COMPOSITE_FOR_PLOTS else "Agility vs Onboard Compute"
    )

    plot_scatter_with_labels(
        df,
        x_key=plot1_x,
        y_key="Agility_TWR",
        xlabel=plot1_xlabel,
        ylabel="Agility (TWR)",
        title=plot1_title,
        log_x=USE_LOG_SCALE and not USE_COMPOSITE_FOR_PLOTS,
    )

    plot3_x = (
        "Composite_Score_x_Agility_per_Span"
        if USE_COMPOSITE_FOR_PLOTS
        else "Compute_x_Agility_per_Span"
    )
    plot3_xlabel = (
        "Composite Score × Agility / Diagonal Span (mm)"
        if USE_COMPOSITE_FOR_PLOTS
        else "Compute × Agility / Diagonal Span (mm)"
    )
    plot3_title = (
        "Sensory Capability vs Composite Score × Agility / Diagonal Span"
        if USE_COMPOSITE_FOR_PLOTS
        else "Sensory Capability vs Compute × Agility / Diagonal Span"
    )

    # plot_scatter_with_labels(
    #     df,
    #     x_key=plot3_x,
    #     y_key="Sensory_1to5",
    #     xlabel=plot3_xlabel,
    #     ylabel="Sensory Capability (1–5)",
    #     title=plot3_title,
    # )

    plot2_x = "Composite_Score_x_Agility" if USE_COMPOSITE_FOR_PLOTS else "Compute_x_Agility"
    plot2_xlabel = "Composite Score × Agility" if USE_COMPOSITE_FOR_PLOTS else "Compute × Agility"
    plot2_title = (
        "Sensory Capability vs Composite Score × Agility"
        if USE_COMPOSITE_FOR_PLOTS
        else "Sensory Capability vs Compute × Agility"
    )

    plot_scatter_with_labels(
        df,
        x_key=plot2_x,
        y_key="Sensory_1to5",
        xlabel=plot2_xlabel,
        ylabel="Sensory Capability (1–5)",
        title=plot2_title,
    )


if __name__ == "__main__":
    main()